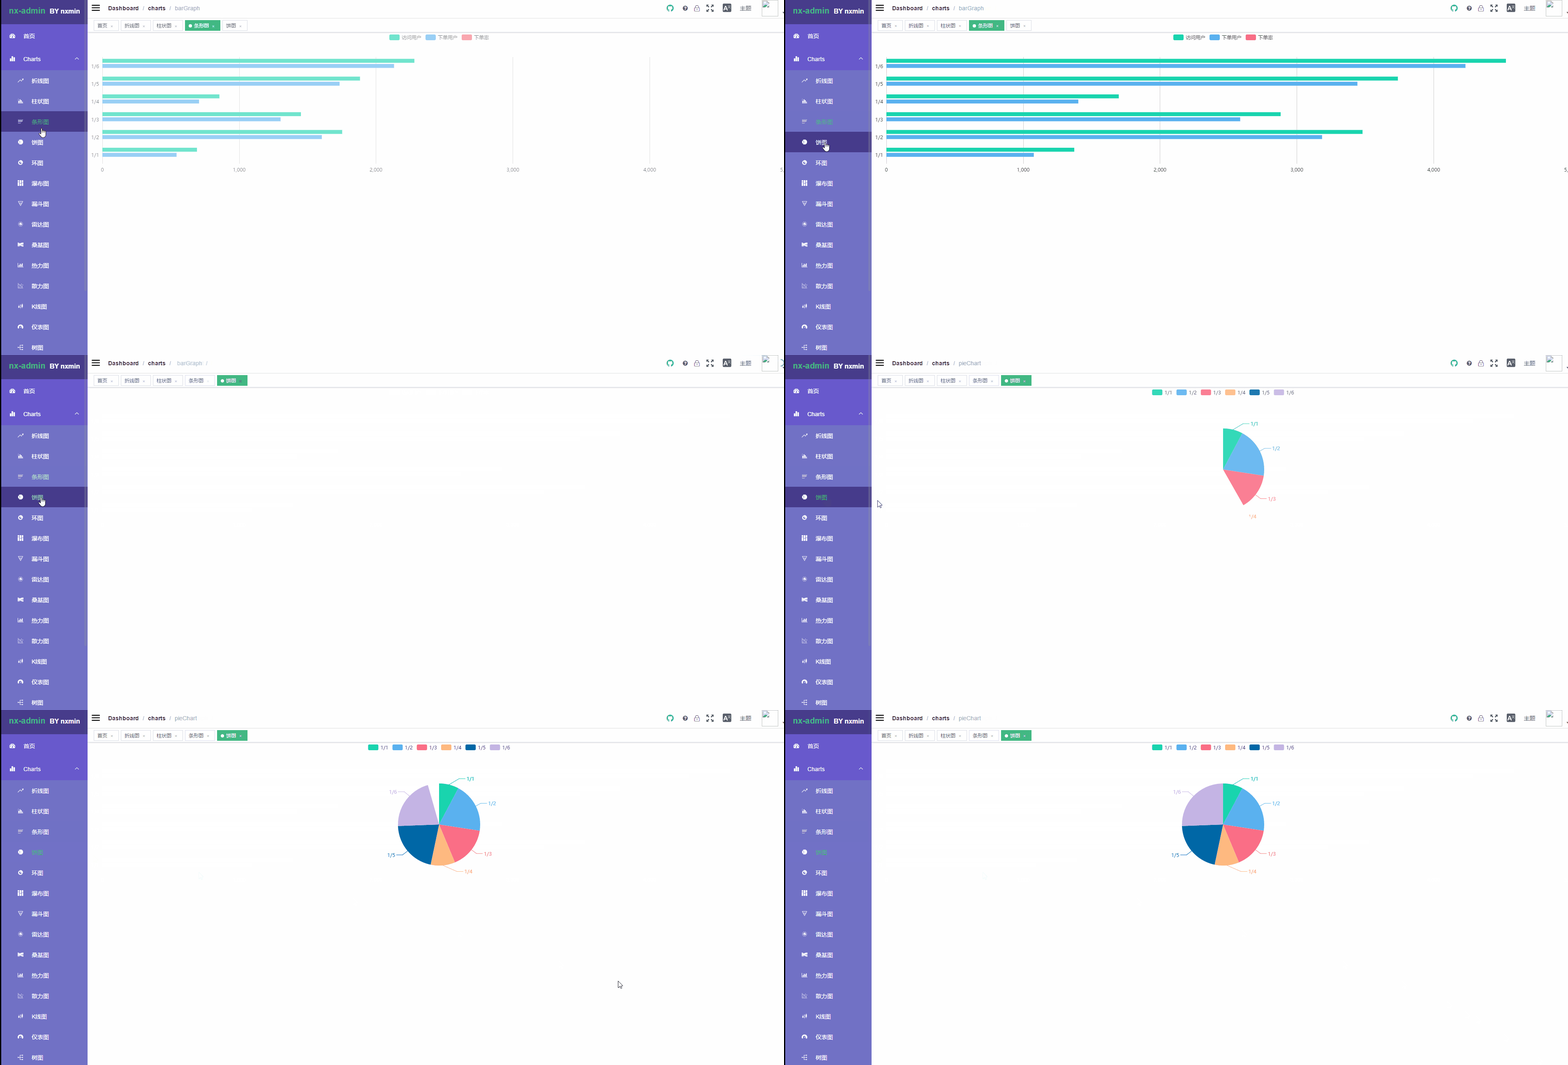
Chart
Managing background charts is also a common requirement. The chart here only recommends v-charts, full-featured, community demo is also rich v-charts。
When generating charts using echarts, it is often necessary to do tedious data type conversion and modify complex configuration items. V-charts are designed to solve this pain point. Based on Vue2.0 and echarts packaged v-charts diagram components, you can easily generate common charts by uniformly providing a simple configuration item with a data format friendly to both the front and the back
install
npm i v-charts echarts -S
Introduction (in main.js)
import VCharts from 'v-charts'
get started quickly
<template>
  <div>
    <ve-line :data="chartData"></ve-line>
  </div>
</template>

<script>
import VeLine from 'v-charts/lib/line'
export default {
  created () {
    this.chartData = {
     columns: ['date', 'sales'],
     rows: [
              { 'date': '1月1日', 'sales': 123 },
              { 'date': '1月2日', 'sales': 1223 },
              { 'date': '1月3日', 'sales': 2123 },
              { 'date': '1月4日', 'sales': 4123 },
              { 'date': '1月5日', 'sales': 3123 },
              { 'date': '1月6日', 'sales': 7123 }
            ]
    }
  },

  components: { VeLine }
}
</script>
In fact, they are all similar, or they must be combined with their own business. There is no difference between using ECharts in peacetime.
Demo

Code
@/views/chart/
Ohters
Of course there are many other libraries in the community, such as d3 , Chart.js , chartist-js. The packaging methods are almost the same, and they are no longer here.